Virtual Thread benchmark
用 JMH 和 JMeter 对比平台线程池、平台线程 per task 与虚线程 per task 在阻塞任务中的表现。
JDK21如期发布,Virtual Thread的benckmark来了!
flowchart LR
    Task["10,000 个 sleep 阻塞任务"] --> Cached["newCachedThreadPool<br/>平台线程池,复用 OS 线程"]
    Task --> PlatformPerTask["newThreadPerTaskExecutor<br/>每任务一个平台线程"]
    Task --> VirtualPerTask["newVirtualThreadPerTaskExecutor<br/>每任务一个虚线程"]
    Cached --> Result["比较 Throughput / AverageTime"]
    PlatformPerTask --> Result
    VirtualPerTask --> Result
    VirtualPerTask --> Expect["阻塞时释放 carrier thread<br/>更适合大量 I/O wait"]

    style VirtualPerTask fill:#e8f5e9,stroke:#2e7d32
    style PlatformPerTask fill:#ffe3e3,stroke:#c62828
client压测
虚线程的意义在于:使用虚线程(可以是直接new,也可以是虚线程池,当然我们倾向于线程池)跑blocking任务更高效,所以不必使用reactive框架继续分解任务了。但因为依然使用(虚)线程池,所以仍然需要异步提交任务。
以sleep模拟blocking任务,分别使用os线程和虚线程执行。
os线程
虽然是线程池,但是本质上,一个任务还是和一个线程强绑定的:
1
2
3
4
5
6
7
8
9
10
    private static void thread(Runnable task) {
        long start = System.nanoTime();

        try (ExecutorService executorService = Executors.newCachedThreadPool()) {
            IntStream.range(0, ITERATION)
                    .forEach(number -> executorService.submit(task));
        }
        long end = System.nanoTime();
        System.out.println("Completed " + COUNTER.intValue() + " tasks in " + (end - start)/1000000 + "ms");
    }
这里使用了try with resource,它会在最后调用close方法,而executor的close方法会在所有已提交任务结束后才关闭线程池,所以并不是提交完任务主程序就结束了。
Initiates an orderly shutdown in which previously submitted tasks are executed, but no new tasks will be accepted. This method waits until all tasks have completed execution and the executor has terminated.
所以调用close本身就有等待线程池结束的意思。
虚线程
一个任务和一个虚线程强绑定,和线程不强绑定:
1
2
3
4
5
6
7
8
9
    private static void virtualThread(Runnable task) {
        long start = System.nanoTime();
        try (ExecutorService executor = Executors.newVirtualThreadPerTaskExecutor()) {
            IntStream.range(0, ITERATION)
                    .forEach(number -> executor.submit(task));
        }
        long end = System.nanoTime();
        System.out.println("Completed " + COUNTER.intValue() + " tasks in " + (end - start)/1000000 + "ms");
    }
简单运行一下,第一个方法需要2864ms,第二个只需要1516ms。
jmh
想更科学精准地量化效果,还是得jmh!
引入依赖:
1
2
3
4
5
6
7
8
9
10
11
        <dependency>
            <groupId>org.openjdk.jmh</groupId>
            <artifactId>jmh-core</artifactId>
            <version>1.37</version>
        </dependency>
        <dependency>
            <groupId>org.openjdk.jmh</groupId>
            <artifactId>jmh-generator-annprocess</artifactId>
            <version>1.37</version>
            <scope>provided</scope>
        </dependency>
参考这个项目对三种线程池进行测试:
Executors.newCachedThreadPool():无限创建os线程,但是如果之前创建的线程有空闲,会复用之前线程池里的线程;Executors.newVirtualThreadPerTaskExecutor():无限创建虚线程,每个task一个虚线程,不池化虚线程;Executors.newThreadPerTaskExecutor(Thread.ofPlatform().factory()):os线程也可以无限创建且不复用,因此可以推测它的性能是最差的。因为它的行为和Executors.newVirtualThreadPerTaskExecutor()类似,特意拉出来跑一跑;
其实
Executors.newVirtualThreadPerTaskExecutor()就是Executors.newThreadPerTaskExecutor(Thread.ofVirtual().factory())。
代码如下:
1
2
3
4
5
6
7
8
9
10
11
12
13
14
15
16
17
18
19
20
21
22
23
24
25
26
27
28
29
30
31
32
33
34
35
36
37
38
39
40
41
42
43
44
45
46
47
48
@Fork(value = 1, jvmArgs = {"-Xms512m", "-Xmx1024m"})
@BenchmarkMode({Mode.Throughput, Mode.AverageTime})
@Warmup(time = 2)
@State(Scope.Benchmark)
@Timeout(time = 60)
@Threads(2)
public class ThreadsBenchmark {

    public static void main(String[] args) throws RunnerException {
        Options opt = new OptionsBuilder()
                .include(ThreadsBenchmark.class.getSimpleName())
                .forks(1)
                .build();

        new Runner(opt).run();
    }

    @Benchmark
    public void platformThreadPool() {
        try (var executor = Executors.newCachedThreadPool()) {
            IntStream.range(0, 10_000).forEach(i -> executor.submit(() -> {
                Thread.sleep(Duration.ofMillis(200));
                return i;
            }));
        }
    }

    @Benchmark
    public void platformThreadPerTask() {
        try (var executor = Executors.newThreadPerTaskExecutor(Thread.ofPlatform().factory())) {
            IntStream.range(0, 10_000).forEach(i -> executor.submit(() -> {
                Thread.sleep(Duration.ofMillis(200));
                return i;
            }));
        }
    }

    @Benchmark
    public void virtualThreadPerTask() {
        try (var executor = Executors.newVirtualThreadPerTaskExecutor()) {
            IntStream.range(0, 10_000).forEach(i -> executor.submit(() -> {
                Thread.sleep(Duration.ofMillis(200));
                return i;
            }));
        }
    }

}
总共进行了两类benchmark:Mode.Throughput和Mode.AverageTime,前者是算每秒能跑多少次,后者是每次需要跑多少秒。
每次跑之前都会warmup,可以看出来还是很必要的:
1
2
3
4
5
6
7
8
9
10
11
12
13
14
15
16
17
18
19
20
21
22
23
24
# JMH version: 1.37
# VM version: JDK 21, OpenJDK 64-Bit Server VM, 21+35-2513
# VM invoker: C:\Users\puppylpg\.jdks\openjdk-21\bin\java.exe
# VM options: -Xms512m -Xmx1024m
# Blackhole mode: compiler (auto-detected, use -Djmh.blackhole.autoDetect=false to disable)
# Warmup: 5 iterations, 2 s each
# Measurement: 5 iterations, 10 s each
# Timeout: 60 s per iteration
# Threads: 2 threads, will synchronize iterations
# Benchmark mode: Throughput, ops/time
# Benchmark: xyz.puppylpg.vthread.benchmark.ThreadsBenchmark.platformThreadPerTask

# Run progress: 0.00% complete, ETA 00:06:00
# Fork: 1 of 1
# Warmup Iteration   1: 0.336 ops/s
# Warmup Iteration   2: 0.846 ops/s
# Warmup Iteration   3: 0.841 ops/s
# Warmup Iteration   4: 0.851 ops/s
# Warmup Iteration   5: 0.851 ops/s
Iteration   1: 0.856 ops/s
Iteration   2: 0.871 ops/s
Iteration   3: 0.861 ops/s
Iteration   4: 0.856 ops/s
Iteration   5: 0.841 ops/s
第一轮warmup明显不在正常水平。
最终结果如下:
1
2
3
4
5
6
7
Benchmark                                Mode  Cnt  Score   Error  Units
ThreadsBenchmark.platformThreadPerTask  thrpt    5  0.857 ± 0.042  ops/s
ThreadsBenchmark.platformThreadPool     thrpt    5  1.494 ± 0.279  ops/s
ThreadsBenchmark.virtualThreadPerTask   thrpt    5  9.038 ± 0.268  ops/s
ThreadsBenchmark.platformThreadPerTask   avgt    5  2.322 ± 0.081   s/op
ThreadsBenchmark.platformThreadPool      avgt    5  1.426 ± 0.386   s/op
ThreadsBenchmark.virtualThreadPerTask    avgt    5  0.220 ± 0.005   s/op
不出意外,newThreadPerTaskExecutor最差(0.857 ± 0.042 ops/s),池化的会好不少(1.494 ± 0.279 ops/s),但都远远比不上虚线程池(9.038 ± 0.268 ops/s),在该场景下,虚线程池的执行效率大概是os线程池的6倍。
完整日志如下:
1
2
3
4
5
6
7
8
9
10
11
12
13
14
15
16
17
18
19
20
21
22
23
24
25
26
27
28
29
30
31
32
33
34
35
36
37
38
39
40
41
42
43
44
45
46
47
48
49
50
51
52
53
54
55
56
57
58
59
60
61
62
63
64
65
66
67
68
69
70
71
72
73
74
75
76
77
78
79
80
81
82
83
84
85
86
87
88
89
90
91
92
93
94
95
96
97
98
99
100
101
102
103
104
105
106
107
108
109
110
111
112
113
114
115
116
117
118
119
120
121
122
123
124
125
126
127
128
129
130
131
132
133
134
135
136
137
138
139
140
141
142
143
144
145
146
147
148
149
150
151
152
153
154
155
156
157
158
159
160
161
162
163
164
165
166
167
168
169
170
171
172
173
174
175
176
177
178
179
180
181
182
183
184
185
186
187
188
189
190
191
192
193
194
195
196
197
198
199
200
201
202
203
204
205
206
207
208
209
210
211
212
213
214
215
216
217
C:\Users\puppylpg\.jdks\openjdk-21\bin\java.exe "-javaagent:C:\Users\puppylpg\AppData\Local\Programs\IntelliJ IDEA Ultimate\lib\idea_rt.jar=2906:C:\Users\puppylpg\AppData\Local\Programs\IntelliJ IDEA Ultimate\bin" -Dfile.encoding=UTF-8 -Dsun.stdout.encoding=UTF-8 -Dsun.stderr.encoding=UTF-8 -classpath C:\Users\puppylpg\Documents\GitHub\java-examples\8-plus\normal\target\classes;C:\Users\puppylpg\.m2\repository\org\apache\tomcat\embed\tomcat-embed-core\11.0.0-M7\tomcat-embed-core-11.0.0-M7.jar;C:\Users\puppylpg\.m2\repository\org\apache\tomcat\tomcat-annotations-api\11.0.0-M7\tomcat-annotations-api-11.0.0-M7.jar;C:\Users\puppylpg\.m2\repository\org\openjdk\jmh\jmh-core\1.37\jmh-core-1.37.jar;C:\Users\puppylpg\.m2\repository\net\sf\jopt-simple\jopt-simple\5.0.4\jopt-simple-5.0.4.jar;C:\Users\puppylpg\.m2\repository\org\apache\commons\commons-math3\3.6.1\commons-math3-3.6.1.jar xyz.puppylpg.vthread.benchmark.ThreadsBenchmark
# JMH version: 1.37
# VM version: JDK 21, OpenJDK 64-Bit Server VM, 21+35-2513
# VM invoker: C:\Users\puppylpg\.jdks\openjdk-21\bin\java.exe
# VM options: -Xms512m -Xmx1024m
# Blackhole mode: compiler (auto-detected, use -Djmh.blackhole.autoDetect=false to disable)
# Warmup: 5 iterations, 2 s each
# Measurement: 5 iterations, 10 s each
# Timeout: 60 s per iteration
# Threads: 2 threads, will synchronize iterations
# Benchmark mode: Throughput, ops/time
# Benchmark: xyz.puppylpg.vthread.benchmark.ThreadsBenchmark.platformThreadPerTask

# Run progress: 0.00% complete, ETA 00:06:00
# Fork: 1 of 1
# Warmup Iteration   1: 0.336 ops/s
# Warmup Iteration   2: 0.846 ops/s
# Warmup Iteration   3: 0.841 ops/s
# Warmup Iteration   4: 0.851 ops/s
# Warmup Iteration   5: 0.851 ops/s
Iteration   1: 0.856 ops/s
Iteration   2: 0.871 ops/s
Iteration   3: 0.861 ops/s
Iteration   4: 0.856 ops/s
Iteration   5: 0.841 ops/s


Result "xyz.puppylpg.vthread.benchmark.ThreadsBenchmark.platformThreadPerTask":
0.857 ±(99.9%) 0.042 ops/s [Average]
(min, avg, max) = (0.841, 0.857, 0.871), stdev = 0.011
CI (99.9%): [0.815, 0.899] (assumes normal distribution)


# JMH version: 1.37
# VM version: JDK 21, OpenJDK 64-Bit Server VM, 21+35-2513
# VM invoker: C:\Users\puppylpg\.jdks\openjdk-21\bin\java.exe
# VM options: -Xms512m -Xmx1024m
# Blackhole mode: compiler (auto-detected, use -Djmh.blackhole.autoDetect=false to disable)
# Warmup: 5 iterations, 2 s each
# Measurement: 5 iterations, 10 s each
# Timeout: 60 s per iteration
# Threads: 2 threads, will synchronize iterations
# Benchmark mode: Throughput, ops/time
# Benchmark: xyz.puppylpg.vthread.benchmark.ThreadsBenchmark.platformThreadPool

# Run progress: 16.67% complete, ETA 00:07:51
# Fork: 1 of 1
# Warmup Iteration   1: 1.494 ops/s
# Warmup Iteration   2: 1.330 ops/s
# Warmup Iteration   3: 1.301 ops/s
# Warmup Iteration   4: 1.341 ops/s
# Warmup Iteration   5: 1.181 ops/s
Iteration   1: 1.430 ops/s
Iteration   2: 1.510 ops/s
Iteration   3: 1.421 ops/s
Iteration   4: 1.513 ops/s
Iteration   5: 1.599 ops/s


Result "xyz.puppylpg.vthread.benchmark.ThreadsBenchmark.platformThreadPool":
1.494 ±(99.9%) 0.279 ops/s [Average]
(min, avg, max) = (1.421, 1.494, 1.599), stdev = 0.072
CI (99.9%): [1.215, 1.774] (assumes normal distribution)


# JMH version: 1.37
# VM version: JDK 21, OpenJDK 64-Bit Server VM, 21+35-2513
# VM invoker: C:\Users\puppylpg\.jdks\openjdk-21\bin\java.exe
# VM options: -Xms512m -Xmx1024m
# Blackhole mode: compiler (auto-detected, use -Djmh.blackhole.autoDetect=false to disable)
# Warmup: 5 iterations, 2 s each
# Measurement: 5 iterations, 10 s each
# Timeout: 60 s per iteration
# Threads: 2 threads, will synchronize iterations
# Benchmark mode: Throughput, ops/time
# Benchmark: xyz.puppylpg.vthread.benchmark.ThreadsBenchmark.virtualThreadPerTask

# Run progress: 33.33% complete, ETA 00:05:45
# Fork: 1 of 1
# Warmup Iteration   1: 5.175 ops/s
# Warmup Iteration   2: 8.754 ops/s
# Warmup Iteration   3: 8.863 ops/s
# Warmup Iteration   4: 9.138 ops/s
# Warmup Iteration   5: 8.983 ops/s
Iteration   1: 8.981 ops/s
Iteration   2: 9.124 ops/s
Iteration   3: 9.078 ops/s
Iteration   4: 9.050 ops/s
Iteration   5: 8.954 ops/s


Result "xyz.puppylpg.vthread.benchmark.ThreadsBenchmark.virtualThreadPerTask":
9.038 ±(99.9%) 0.268 ops/s [Average]
(min, avg, max) = (8.954, 9.038, 9.124), stdev = 0.070
CI (99.9%): [8.770, 9.305] (assumes normal distribution)


# JMH version: 1.37
# VM version: JDK 21, OpenJDK 64-Bit Server VM, 21+35-2513
# VM invoker: C:\Users\puppylpg\.jdks\openjdk-21\bin\java.exe
# VM options: -Xms512m -Xmx1024m
# Blackhole mode: compiler (auto-detected, use -Djmh.blackhole.autoDetect=false to disable)
# Warmup: 5 iterations, 2 s each
# Measurement: 5 iterations, 10 s each
# Timeout: 60 s per iteration
# Threads: 2 threads, will synchronize iterations
# Benchmark mode: Average time, time/op
# Benchmark: xyz.puppylpg.vthread.benchmark.ThreadsBenchmark.platformThreadPerTask

# Run progress: 50.00% complete, ETA 00:03:56
# Fork: 1 of 1
# Warmup Iteration   1: 2.577 s/op
# Warmup Iteration   2: 2.357 s/op
# Warmup Iteration   3: 2.371 s/op
# Warmup Iteration   4: 2.357 s/op
# Warmup Iteration   5: 2.382 s/op
Iteration   1: 2.313 s/op
Iteration   2: 2.317 s/op
Iteration   3: 2.356 s/op
Iteration   4: 2.301 s/op
Iteration   5: 2.323 s/op


Result "xyz.puppylpg.vthread.benchmark.ThreadsBenchmark.platformThreadPerTask":
2.322 ±(99.9%) 0.081 s/op [Average]
(min, avg, max) = (2.301, 2.322, 2.356), stdev = 0.021
CI (99.9%): [2.241, 2.402] (assumes normal distribution)


# JMH version: 1.37
# VM version: JDK 21, OpenJDK 64-Bit Server VM, 21+35-2513
# VM invoker: C:\Users\puppylpg\.jdks\openjdk-21\bin\java.exe
# VM options: -Xms512m -Xmx1024m
# Blackhole mode: compiler (auto-detected, use -Djmh.blackhole.autoDetect=false to disable)
# Warmup: 5 iterations, 2 s each
# Measurement: 5 iterations, 10 s each
# Timeout: 60 s per iteration
# Threads: 2 threads, will synchronize iterations
# Benchmark mode: Average time, time/op
# Benchmark: xyz.puppylpg.vthread.benchmark.ThreadsBenchmark.platformThreadPool

# Run progress: 66.67% complete, ETA 00:02:42
# Fork: 1 of 1
# Warmup Iteration   1: 1.378 s/op
# Warmup Iteration   2: 1.417 s/op
# Warmup Iteration   3: 1.357 s/op
# Warmup Iteration   4: 1.402 s/op
# Warmup Iteration   5: 1.372 s/op
Iteration   1: 1.300 s/op
Iteration   2: 1.509 s/op
Iteration   3: 1.540 s/op
Iteration   4: 1.424 s/op
Iteration   5: 1.360 s/op


Result "xyz.puppylpg.vthread.benchmark.ThreadsBenchmark.platformThreadPool":
1.426 ±(99.9%) 0.386 s/op [Average]
(min, avg, max) = (1.300, 1.426, 1.540), stdev = 0.100
CI (99.9%): [1.040, 1.813] (assumes normal distribution)


# JMH version: 1.37
# VM version: JDK 21, OpenJDK 64-Bit Server VM, 21+35-2513
# VM invoker: C:\Users\puppylpg\.jdks\openjdk-21\bin\java.exe
# VM options: -Xms512m -Xmx1024m
# Blackhole mode: compiler (auto-detected, use -Djmh.blackhole.autoDetect=false to disable)
# Warmup: 5 iterations, 2 s each
# Measurement: 5 iterations, 10 s each
# Timeout: 60 s per iteration
# Threads: 2 threads, will synchronize iterations
# Benchmark mode: Average time, time/op
# Benchmark: xyz.puppylpg.vthread.benchmark.ThreadsBenchmark.virtualThreadPerTask

# Run progress: 83.33% complete, ETA 00:01:20
# Fork: 1 of 1
# Warmup Iteration   1: 0.382 s/op
# Warmup Iteration   2: 0.223 s/op
# Warmup Iteration   3: 0.220 s/op
# Warmup Iteration   4: 0.220 s/op
# Warmup Iteration   5: 0.218 s/op
Iteration   1: 0.219 s/op
Iteration   2: 0.219 s/op
Iteration   3: 0.222 s/op
Iteration   4: 0.219 s/op
Iteration   5: 0.219 s/op


Result "xyz.puppylpg.vthread.benchmark.ThreadsBenchmark.virtualThreadPerTask":
0.220 ±(99.9%) 0.005 s/op [Average]
(min, avg, max) = (0.219, 0.220, 0.222), stdev = 0.001
CI (99.9%): [0.215, 0.224] (assumes normal distribution)


# Run complete. Total time: 00:07:46

REMEMBER: The numbers below are just data. To gain reusable insights, you need to follow up on
why the numbers are the way they are. Use profilers (see -prof, -lprof), design factorial
experiments, perform baseline and negative tests that provide experimental control, make sure
the benchmarking environment is safe on JVM/OS/HW level, ask for reviews from the domain experts.
Do not assume the numbers tell you what you want them to tell.

NOTE: Current JVM experimentally supports Compiler Blackholes, and they are in use. Please exercise
extra caution when trusting the results, look into the generated code to check the benchmark still
works, and factor in a small probability of new VM bugs. Additionally, while comparisons between
different JVMs are already problematic, the performance difference caused by different Blackhole
modes can be very significant. Please make sure you use the consistent Blackhole mode for comparisons.

Benchmark                                Mode  Cnt  Score   Error  Units
ThreadsBenchmark.platformThreadPerTask  thrpt    5  0.857 ± 0.042  ops/s
ThreadsBenchmark.platformThreadPool     thrpt    5  1.494 ± 0.279  ops/s
ThreadsBenchmark.virtualThreadPerTask   thrpt    5  9.038 ± 0.268  ops/s
ThreadsBenchmark.platformThreadPerTask   avgt    5  2.322 ± 0.081   s/op
ThreadsBenchmark.platformThreadPool      avgt    5  1.426 ± 0.386   s/op
ThreadsBenchmark.virtualThreadPerTask    avgt    5  0.220 ± 0.005   s/op

Process finished with exit code 0
server压测
使用虚线程实现服务端,压测一下。
当前(2023-09-26)springboot还没有正式发布3.2,但是已经有了3.2.0-M3。根据All together now: Spring Boot 3.2, GraalVM native images, Java 21, and virtual threads with Project Loom、Embracing Virtual Threads和Working with Virtual Threads in Spring 6,可以先使用milestone版本的springboot测试一下虚线程在服务端的表现。
配置一个简单的web服务:
1
2
3
4
5
6
7
8
9
10
11
12
13
14
15
16
@Tag(name = "thread相关", description = "看看是不是虚线程")
@RestController
@RequestMapping("/thread")
public class ThreadController {

    @GetMapping("/name")
    public String getThreadName() {
        return Thread.currentThread().toString();
    }

    @GetMapping("/benchmark")
    public String benchmark() throws InterruptedException {
        Thread.sleep(Duration.ofMillis(1000));
        return Thread.currentThread().toString();
    }
}
开启虚线程:
1
2
3
4
spring:
    threads:
        virtual:
            enabled: true
开启虚线程的效果:
1
2
$ curl -u hello:world http://localhost:8081/wtf/thread/benchmark
VirtualThread[#78,tomcat-handler-0]/runnable@ForkJoinPool-1-worker-1
使用的是虚线程,实际的执行者是fork join pool。
不开启虚线程的效果:
1
2
$ curl -u hello:world http://localhost:8081/wtf/thread/benchmark
Thread[#58,http-nio-8081-exec-2,5,main]
使用的是os线程。
jmeter
使用jmeter对server进行压测。jmeter有两种模式,gui和cli,一般创建配置文件使用gui,真正的压测使用cli。
建议使用sdkman安装最新版jmeter(5.6),因为Debian bookworm默认的jmeter(2.13)已经没法使用java21执行了。 启动jmeter之后,会收到提示:
1
2
3
4
5
6
7
8
9
10
11
12
13
14
$ jmeter
WARN StatusConsoleListener The use of package scanning to locate plugins is deprecated and will be removed in a future release
WARN StatusConsoleListener The use of package scanning to locate plugins is deprecated and will be removed in a future release
WARN StatusConsoleListener The use of package scanning to locate plugins is deprecated and will be removed in a future release
WARN StatusConsoleListener The use of package scanning to locate plugins is deprecated and will be removed in a future release
================================================================================
Don't use GUI mode for load testing !, only for Test creation and Test debugging.
For load testing, use CLI Mode (was NON GUI):
   jmeter -n -t [jmx file] -l [results file] -e -o [Path to web report folder]
& increase Java Heap to meet your test requirements:
   Modify current env variable HEAP="-Xms1g -Xmx1g -XX:MaxMetaspaceSize=256m" in the jmeter batch file
Check : https://jmeter.apache.org/usermanual/best-practices.html
================================================================================
官方建议使用cli模式进行压测。
配置文件
配置文件是一个xml格式,咱也不会写,就使用gui创建吧,创建好后会自动生成一个xml文件。
参考使用 JMeter 进行压力测试,因为发送的请求需要basic auth,所以还参考了Basic Authentication in JMeter。
大概要做的:
- 添加一个线程组,配置线程数(1000),压测持续多久;
- 在thread group上(右键)配置一些元件(config element)。依次添加:
- http请求默认值(http request defaults);
- http授权管理器(http authorization manager),给
http://localhost:8081/wtf/thread/benchmark配置basic认证; - 构造http请求:右键thread group,添加sampler,构造http请求(http request)。由于是get请求,比较简单,所以啥也不用写,http request defaults里已经配置过了;
- 判断结果的正确性:assertion,response assertion。这里判断text response里包含(contains)ForkJoinPool或者Thread即可;
- 最后再配置个查看结果的监听器(listener),查看结果树(view results tree);
然后就可以试运行了,jmeter会提示保存xml配置。
有了配置文件,就能用cli进行压测了:
1
$ jmeter -n -t vthread.jmx -l vthread1k.txt -e -o vthread-webreportk
想关闭的话,另开一个console,使用jmeter提供的关闭指令:
1
~/.sdkman/candidates/jmeter/current/bin $ shutdown.sh
结果保存在vthread-webreport1000下。
关闭指令一定要用shutdown,而非stoptest:
- shutdown:Run the Shutdown client to stop a non-GUI instance gracefully
- stoptest:Run the Shutdown client to stop a non-GUI instance abruptly
结果
对jmeter cli输出内容的解释:
Creating summariser <summary>:创建了一个汇总器(summariser)对象,用于收集测试结果的摘要信息。Created the tree successfully using thread.jmx:成功地使用 thread.jmx 文件创建了测试计划。Starting standalone test @ 2023 Sep 26 20:15:42 CST (1695730542580):开始运行独立的测试,显示了测试开始的时间戳。Waiting for possible Shutdown/StopTestNow/HeapDump/ThreadDump message on port 4445:等待可能的关闭/停止测试/堆转储/线程转储消息,监听端口为 4445。summary + ...:这是对测试结果的汇总信息。每一行代表一个时间段内的统计数据。+表示这是新增的统计数据,=表示这是累计的统计数据。summary:汇总数据的标识。+/-:表示新增或减少的请求数量。in 00:00:30:表示该时间段的持续时间。= 39.0/s:平均每秒的请求数量。Avg: 6689:平均响应时间。Min: 1804:最小响应时间。Max: 9845:最大响应时间。Err: 0 (0.00%):错误数量和错误百分比。Active: 676:当前活动的线程数。Started: 676:已启动的线程数。Finished: 0:已完成的线程数。
Command: Shutdown received from /127.0.0.1:收到来自 127.0.0.1 的关闭命令。Tidying up ...:结束测试并进行清理。... end of run:测试运行结束。
从下面的输出可以看到,jmeter的qps并不是固定的。从最后的图标可以看到,jmeter会变换qps测试响应。
测试的时候,执行shutdown时出现了不同的情况:shutdown os线程测试时,请求100%正常结束:
1
2
3
4
5
6
7
8
9
10
11
12
13
14
15
16
17
18
19
20
21
22
23
pichu@pebian ~/jmeter/vthread $ jmeter -n -t thread.jmx -l thread-1k.txt -e -o thread-webreport-1k
WARN StatusConsoleListener The use of package scanning to locate plugins is deprecated and will be removed in a future release
WARN StatusConsoleListener The use of package scanning to locate plugins is deprecated and will be removed in a future release
WARN StatusConsoleListener The use of package scanning to locate plugins is deprecated and will be removed in a future release
WARN StatusConsoleListener The use of package scanning to locate plugins is deprecated and will be removed in a future release
Creating summariser <summary>
Created the tree successfully using thread.jmx
Starting standalone test @ 2023 Sep 26 20:15:42 CST (1695730542580)
Waiting for possible Shutdown/StopTestNow/HeapDump/ThreadDump message on port 4445
summary +    676 in 00:00:17 =   39.0/s Avg:  6689 Min:  1804 Max:  9845 Err:     0 (0.00%) Active: 676 Started: 676 Finished: 0
summary +   1673 in 00:00:30 =   55.7/s Avg: 12555 Min:  1160 Max: 19980 Err:     0 (0.00%) Active: 1000 Started: 1000 Finished: 0
summary =   2349 in 00:00:47 =   49.6/s Avg: 10867 Min:  1160 Max: 19980 Err:     0 (0.00%)
summary +   1645 in 00:00:30 =   54.9/s Avg: 18328 Min:  1453 Max: 23212 Err:     0 (0.00%) Active: 1000 Started: 1000 Finished: 0
summary =   3994 in 00:01:17 =   51.7/s Avg: 13940 Min:  1160 Max: 23212 Err:     0 (0.00%)
summary +   1521 in 00:00:30 =   50.7/s Avg: 19074 Min:  2052 Max: 23383 Err:     0 (0.00%) Active: 1000 Started: 1000 Finished: 0
summary =   5515 in 00:01:47 =   51.4/s Avg: 15356 Min:  1160 Max: 23383 Err:     0 (0.00%)
Command: Shutdown received from /127.0.0.1
summary +   1569 in 00:00:30 =   52.3/s Avg: 19225 Min:  1368 Max: 25939 Err:     0 (0.00%) Active: 469 Started: 1000 Finished: 531
summary =   7084 in 00:02:17 =   51.6/s Avg: 16213 Min:  1160 Max: 25939 Err:     0 (0.00%)
summary +    468 in 00:00:07 =   64.9/s Avg: 20338 Min: 16689 Max: 24892 Err:     0 (0.00%) Active: 0 Started: 1000 Finished: 1000
summary =   7552 in 00:02:25 =   52.2/s Avg: 16468 Min:  1160 Max: 25939 Err:     0 (0.00%)
Tidying up ...    @ 2023 Sep 26 20:18:07 CST (1695730687246)
... end of run
shutdown虚线程测试时,出现了19个timeout,而且超时时间都在130s左右,所以在计算平均时长时,对数据产生了较大影响:
1
2
3
4
5
6
7
8
9
10
11
12
13
14
15
16
17
18
19
20
21
22
23
24
25
$ jmeter -n -t vthread.jmx -l vthread-1k_.txt -e -o vthread-webreport-1k_
WARN StatusConsoleListener The use of package scanning to locate plugins is deprecated and will be removed in a future release
WARN StatusConsoleListener The use of package scanning to locate plugins is deprecated and will be removed in a future release
WARN StatusConsoleListener The use of package scanning to locate plugins is deprecated and will be removed in a future release
WARN StatusConsoleListener The use of package scanning to locate plugins is deprecated and will be removed in a future release
Creating summariser <summary>
Created the tree successfully using vthread.jmx
Starting standalone test @ 2023 Sep 26 20:27:57 CST (1695731277128)
Waiting for possible Shutdown/StopTestNow/HeapDump/ThreadDump message on port 4445
summary +     20 in 00:00:03 =    7.2/s Avg:  1197 Min:  1097 Max:  1557 Err:     0 (0.00%) Active: 31 Started: 31 Finished: 0
summary +   1297 in 00:00:30 =   43.2/s Avg:  2864 Min:  1099 Max: 21224 Err:     0 (0.00%) Active: 365 Started: 365 Finished: 0
summary =   1317 in 00:00:33 =   40.2/s Avg:  2839 Min:  1097 Max: 21224 Err:     0 (0.00%)
summary +   1177 in 00:00:30 =   39.2/s Avg:  6269 Min:  1129 Max: 38270 Err:     0 (0.00%) Active: 698 Started: 698 Finished: 0
summary =   2494 in 00:01:03 =   39.7/s Avg:  4458 Min:  1097 Max: 38270 Err:     0 (0.00%)
summary +   1519 in 00:00:30 =   50.6/s Avg: 13400 Min:  1140 Max: 60812 Err:     0 (0.00%) Active: 1000 Started: 1000 Finished: 0
summary =   4013 in 00:01:33 =   43.2/s Avg:  7842 Min:  1097 Max: 60812 Err:     0 (0.00%)
summary +   1394 in 00:00:30 =   46.5/s Avg: 15647 Min:  1134 Max: 85170 Err:     0 (0.00%) Active: 1000 Started: 1000 Finished: 0
summary =   5407 in 00:02:03 =   44.0/s Avg:  9854 Min:  1097 Max: 85170 Err:     0 (0.00%)
Command: Shutdown received from /127.0.0.1
summary +    957 in 00:00:31 =   30.8/s Avg: 31093 Min:  1130 Max: 87056 Err:     0 (0.00%) Active: 122 Started: 1000 Finished: 878
summary =   6364 in 00:02:34 =   41.3/s Avg: 13048 Min:  1097 Max: 87056 Err:     0 (0.00%)
summary +    121 in 00:00:40 =    3.0/s Avg: 76252 Min: 64833 Max: 130372 Err:    19 (15.70%) Active: 0 Started: 1000 Finished: 1000
summary =   6485 in 00:03:14 =   33.5/s Avg: 14227 Min:  1097 Max: 130372 Err:    19 (0.29%)
Tidying up ...    @ 2023 Sep 26 20:31:11 CST (1695731471000)
... end of run
因此,平均时长意义不大,可以看更详细的响应时间分布数据。
响应时间分布
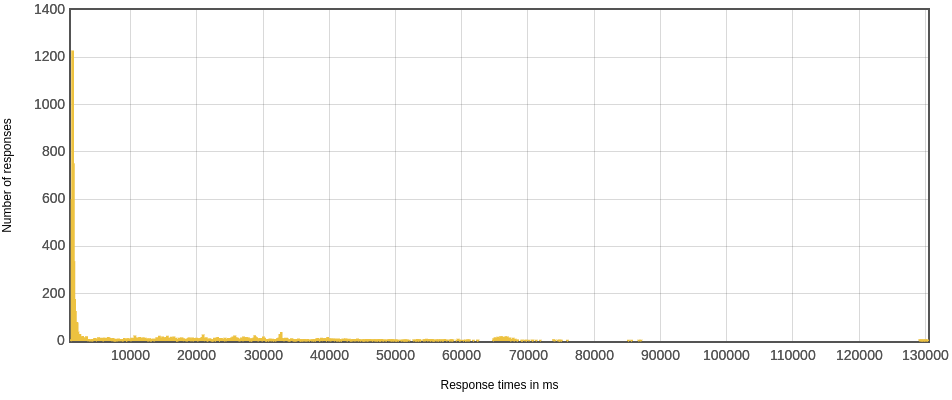
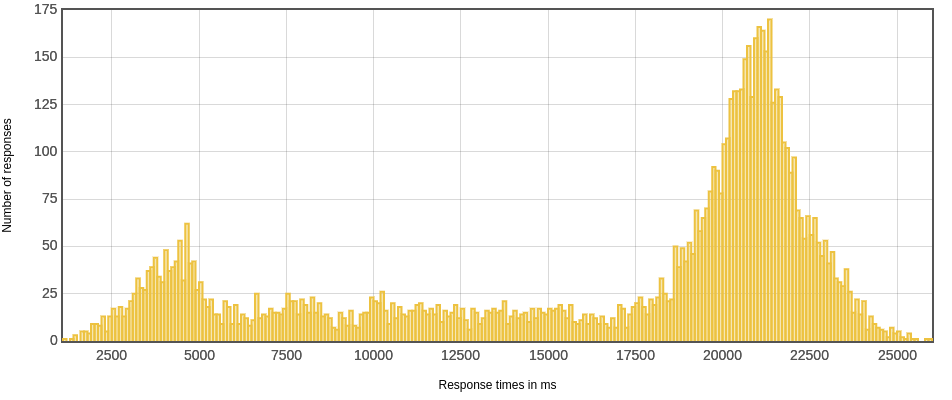
可以看到虚线程对大部分请求的响应都很快(除了最后timeout的那些请求),os线程响应明显比较慢。
响应时间分位数
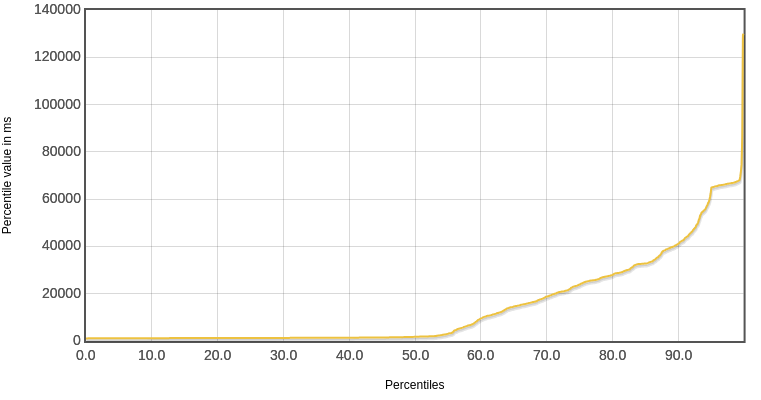
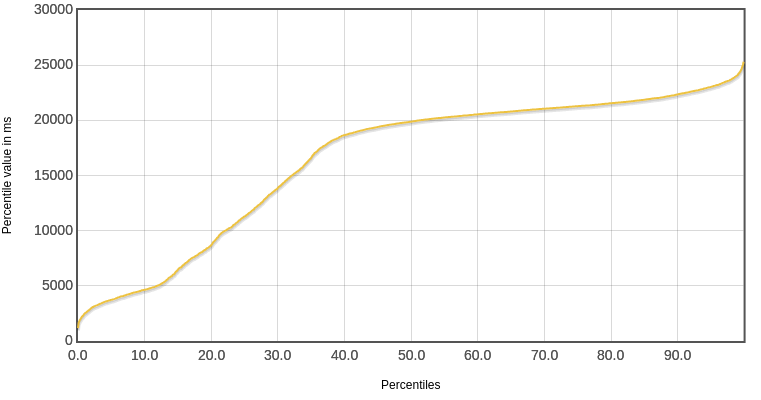
虚线程由于对大部分请求的响应都很快,所以中位数比较低,只有1771ms。os线程对大部分请求的响应都偏慢,所以中位数比较高,达到了19881ms,差了一个量级。
响应时间区间统计
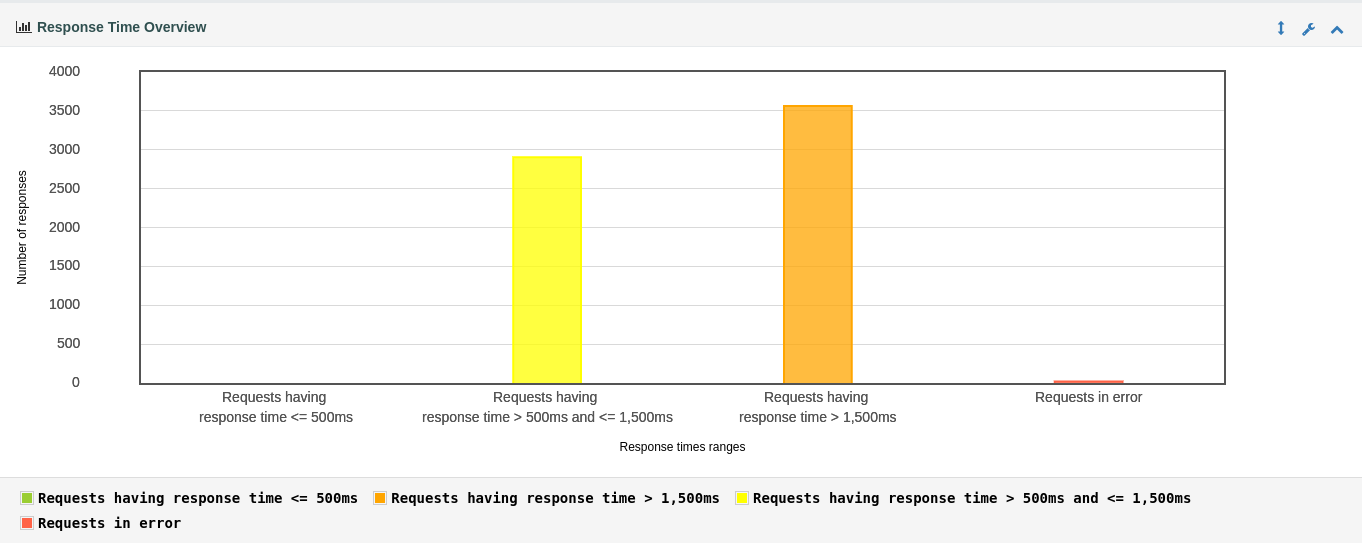
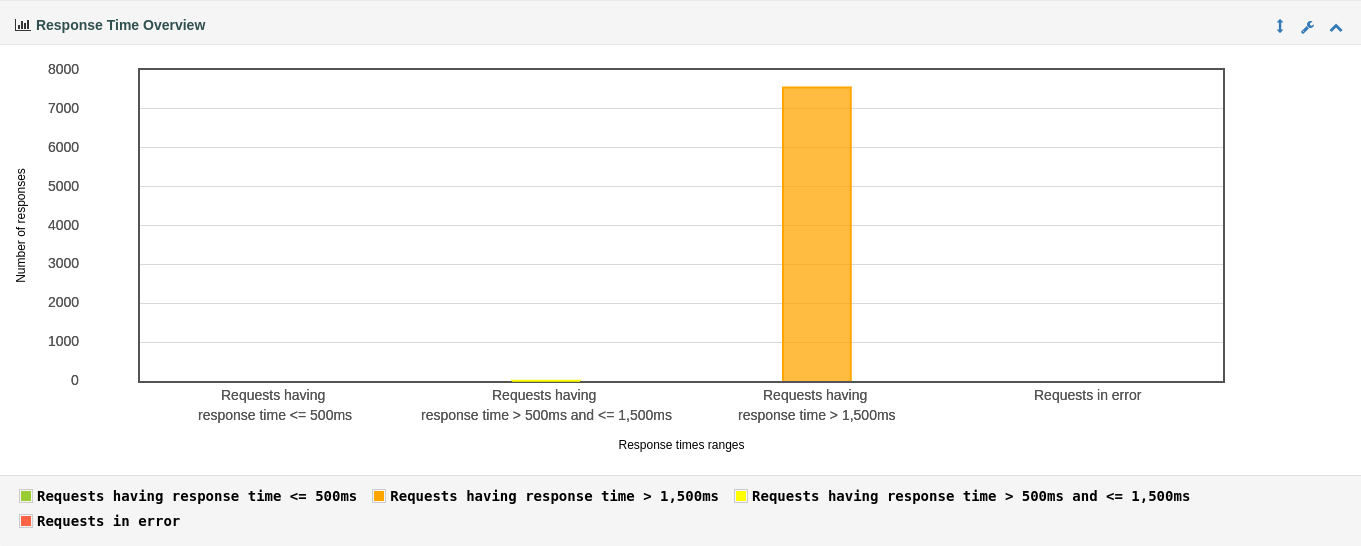
os线程的响应时长几乎全在1500ms以上,虚线程有很多响应都在1500ms以下。结合整个程序的负载(Thread.sleep(Duration.ofMillis(1000)))来看,显然虚线程要合理得多。
不同压力下的响应时间
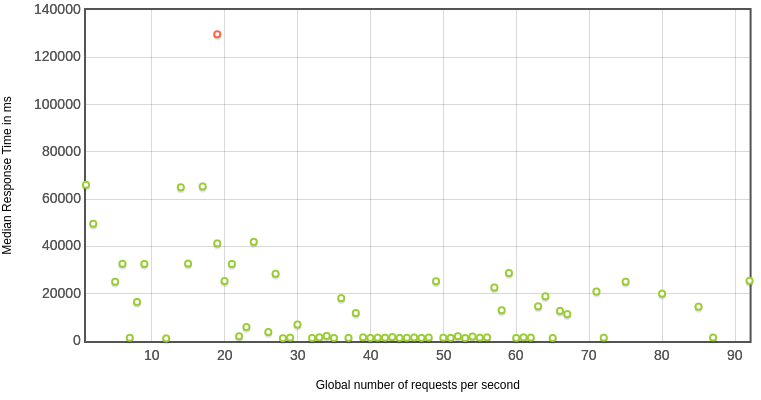
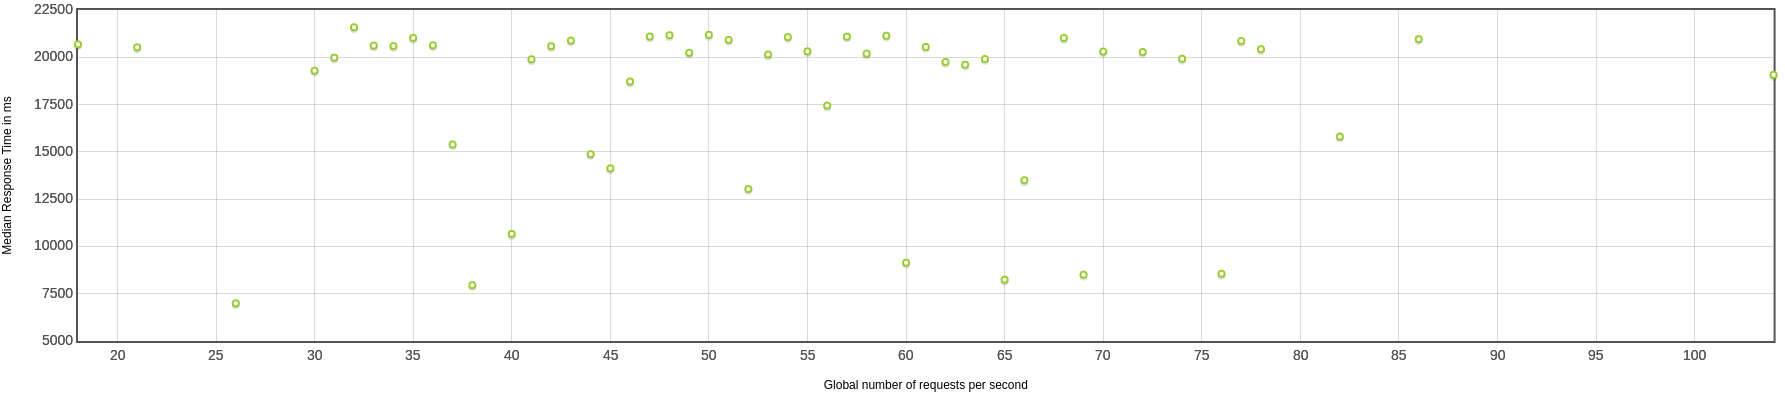
几乎所有的qps下,虚线程都表现的要比os线程好很多。
visualvm
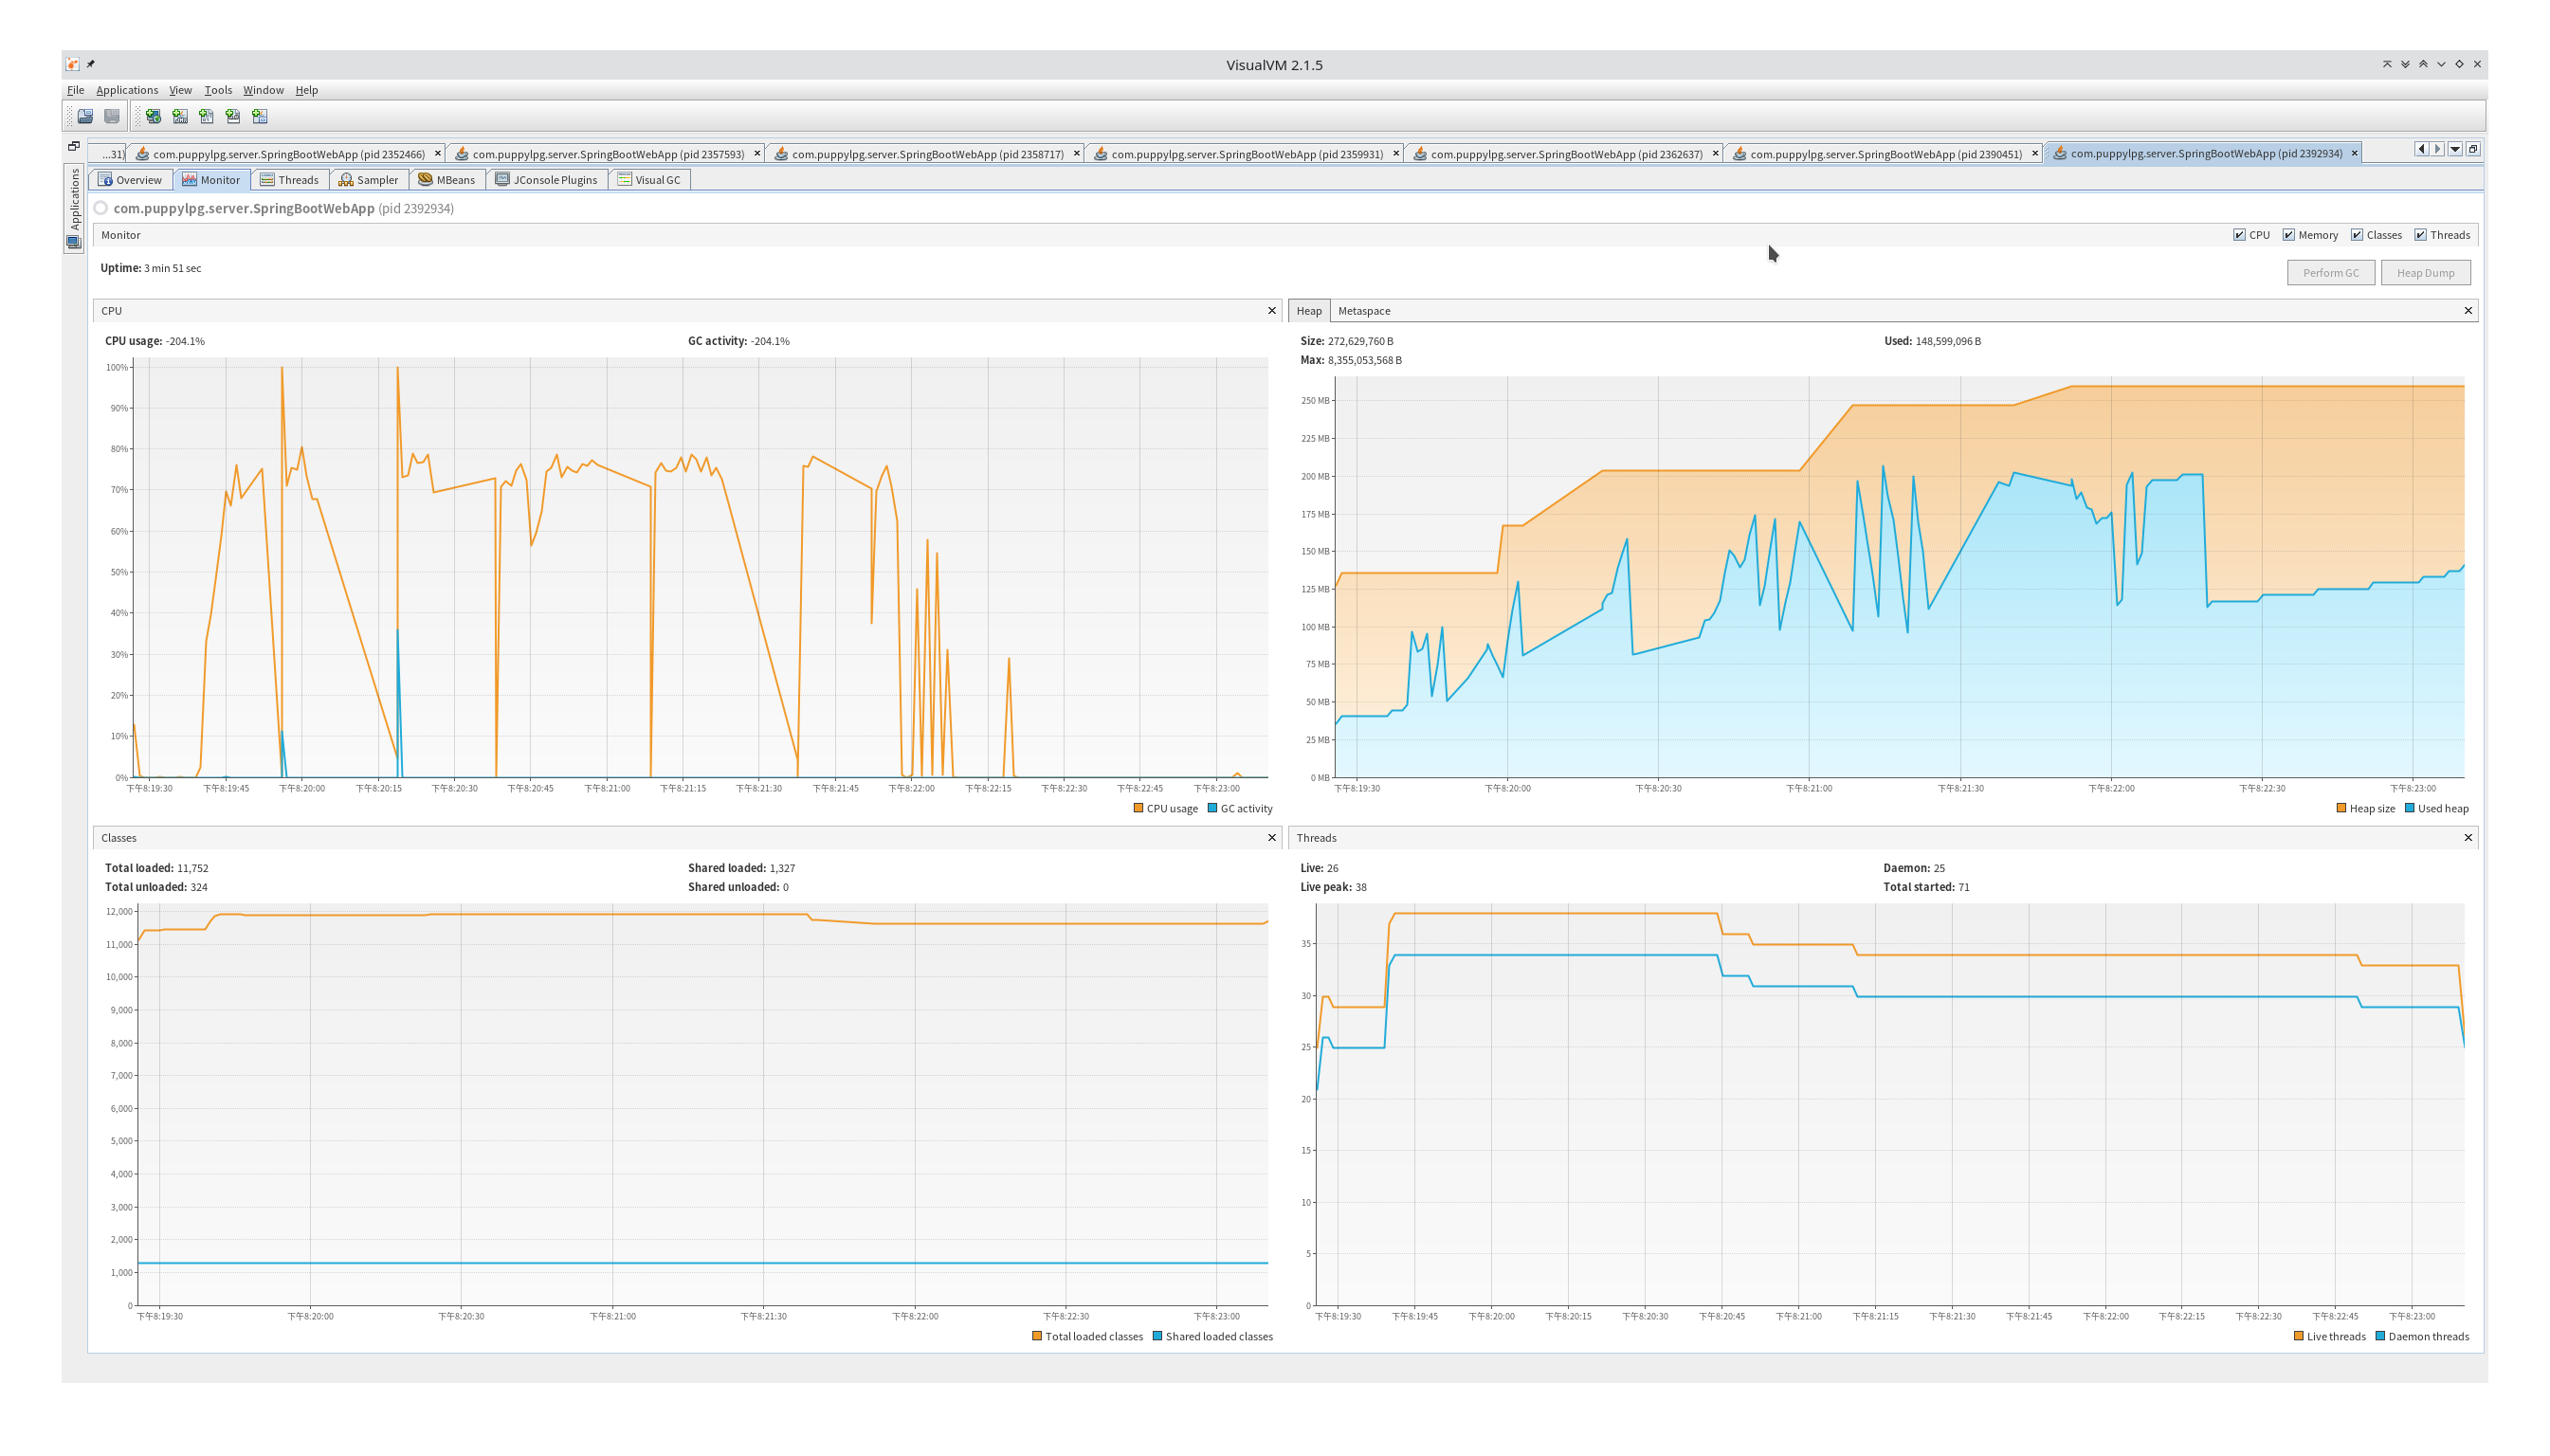
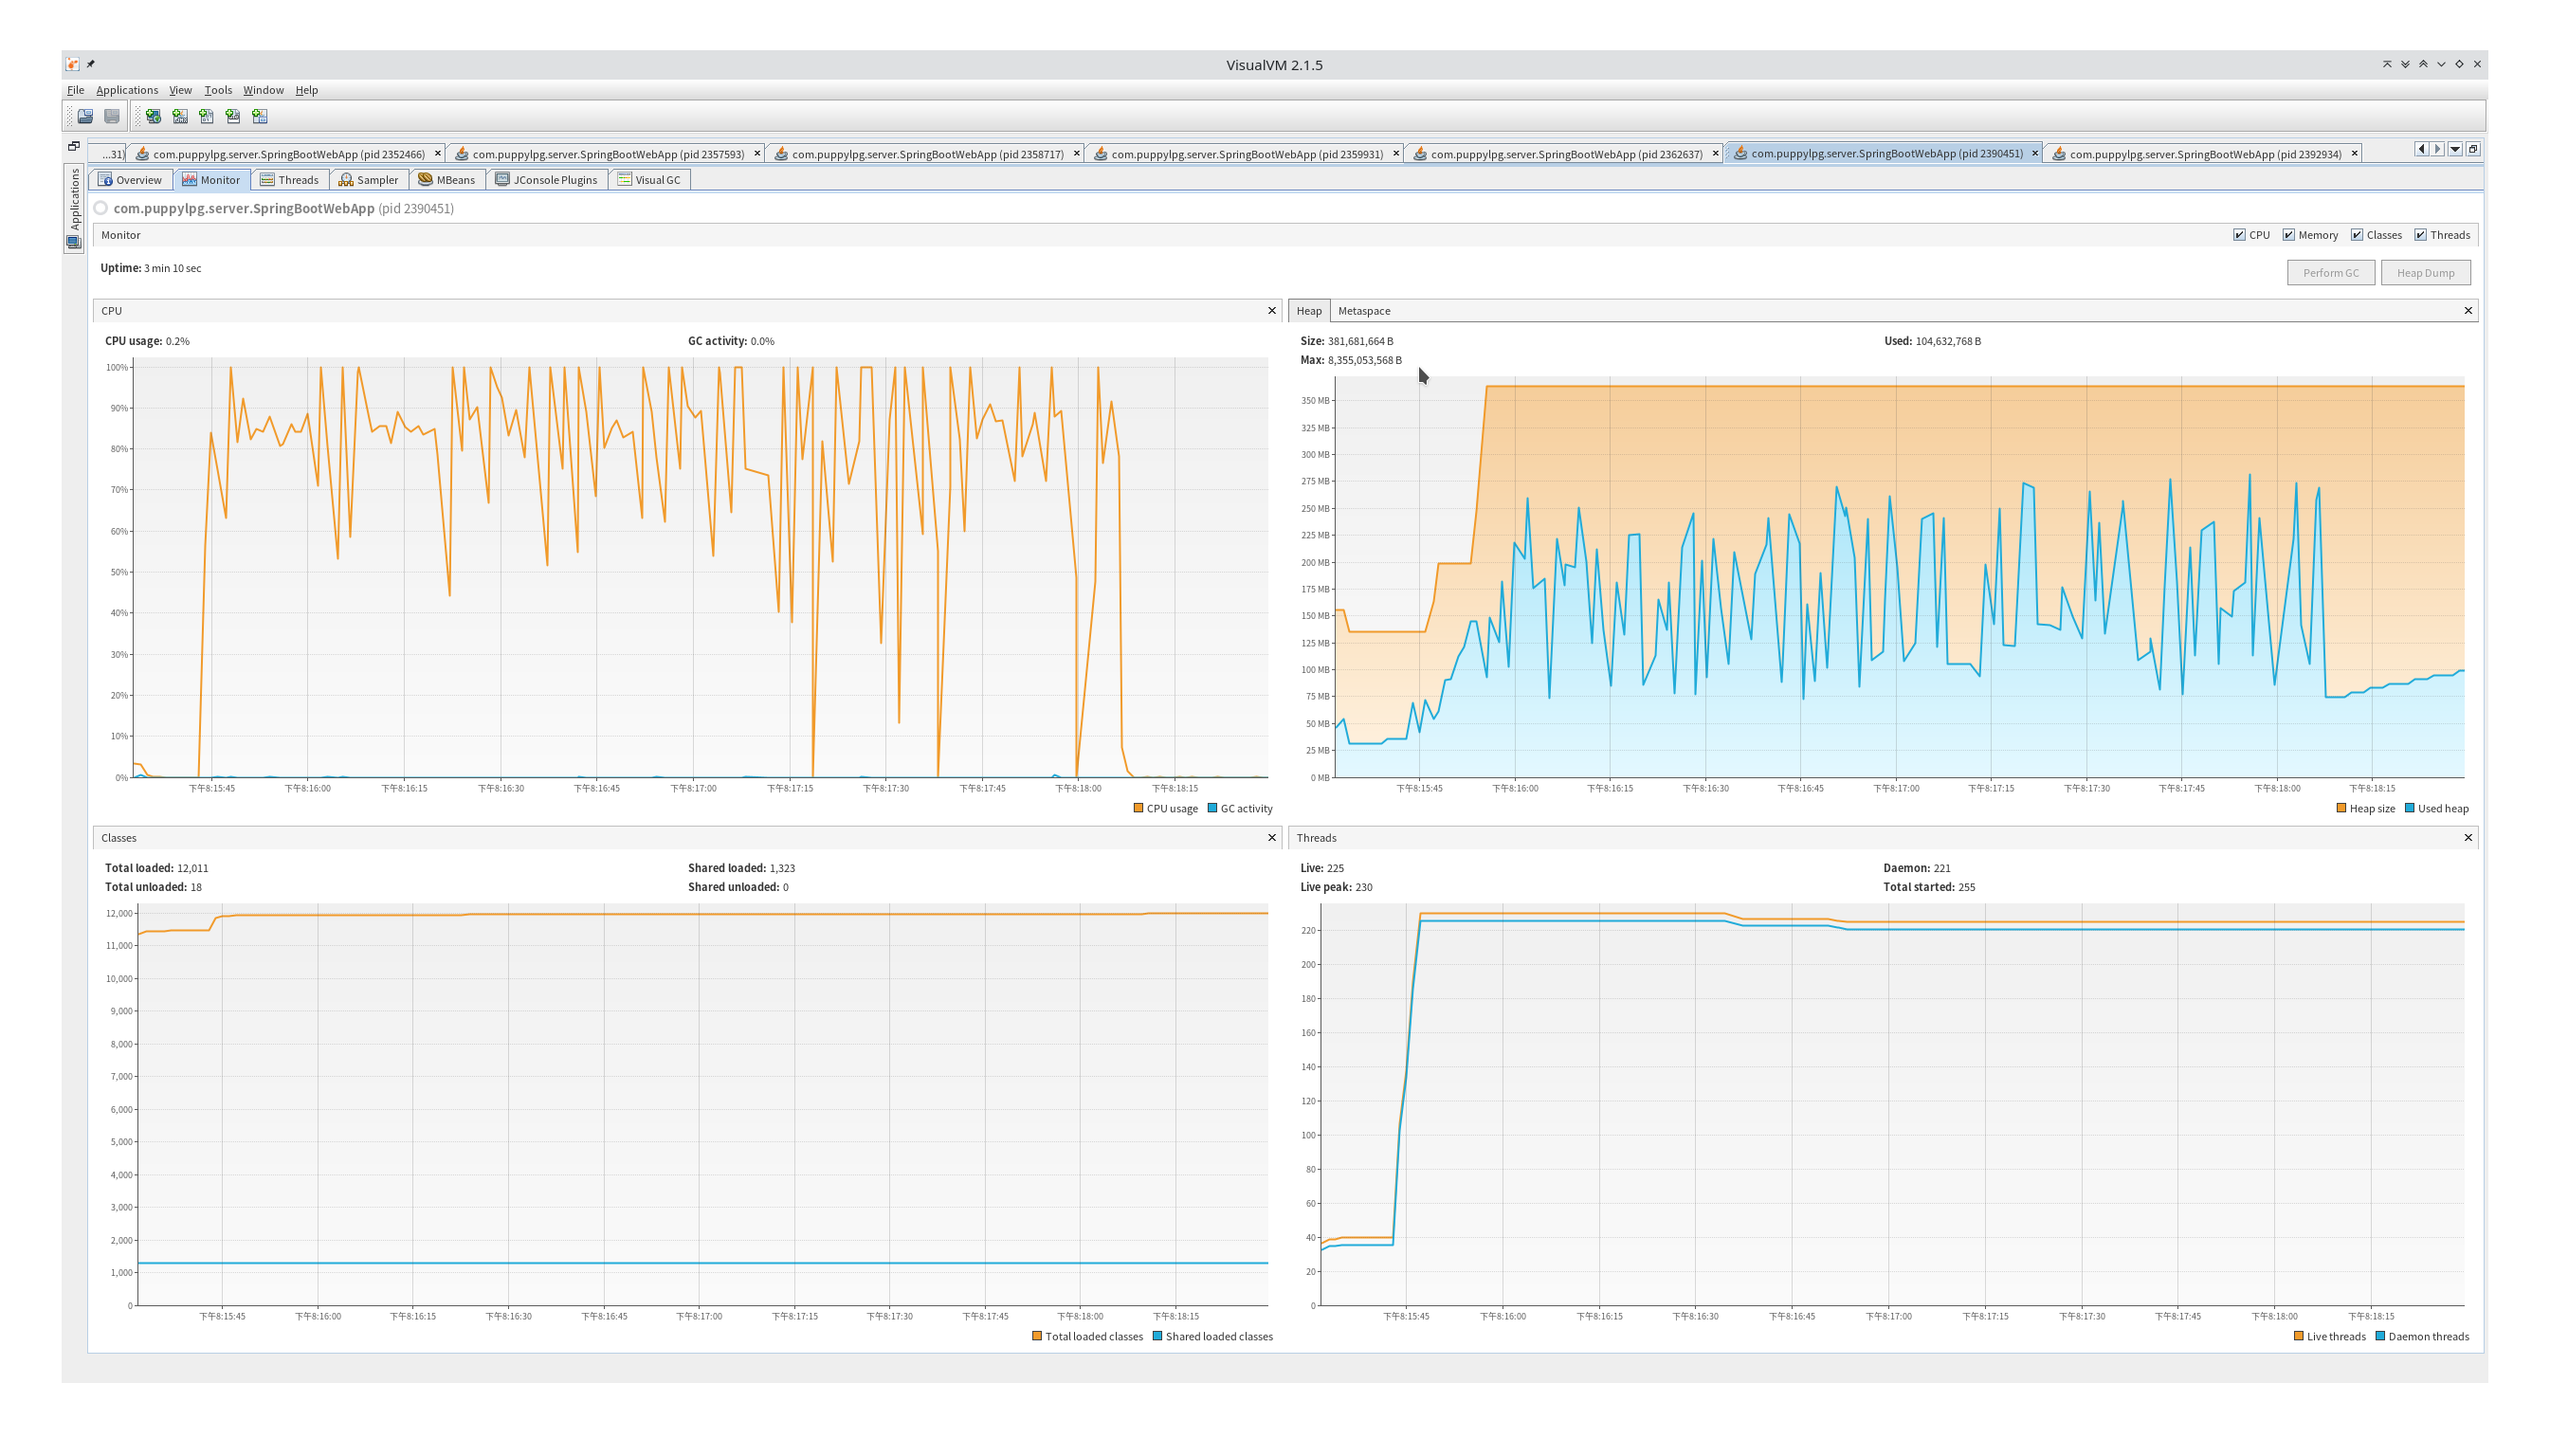
测试的时候还可以使用visualvm查看两种服务的系统metric,很明显os thread时创建了非常多的线程,对cpu和内存都造成了不小的压力。虚线程时整个jvm里创建的os线程很少,cpu和内存gc频率都要好不少。
感想
说JDK21是革命性的确实不为过。虚线程可以在维持原有编程风格的前提下,对blocking code的执行效率提升这么多,那么reactive式的异步编程框架真的还有用吗?谁的效率更高?退一万步说,即使reactive仍有优势,这些优势还足以让程序猿不惜以碎片化代码、高难度的组装代码、高难度的debug为代价吗?